

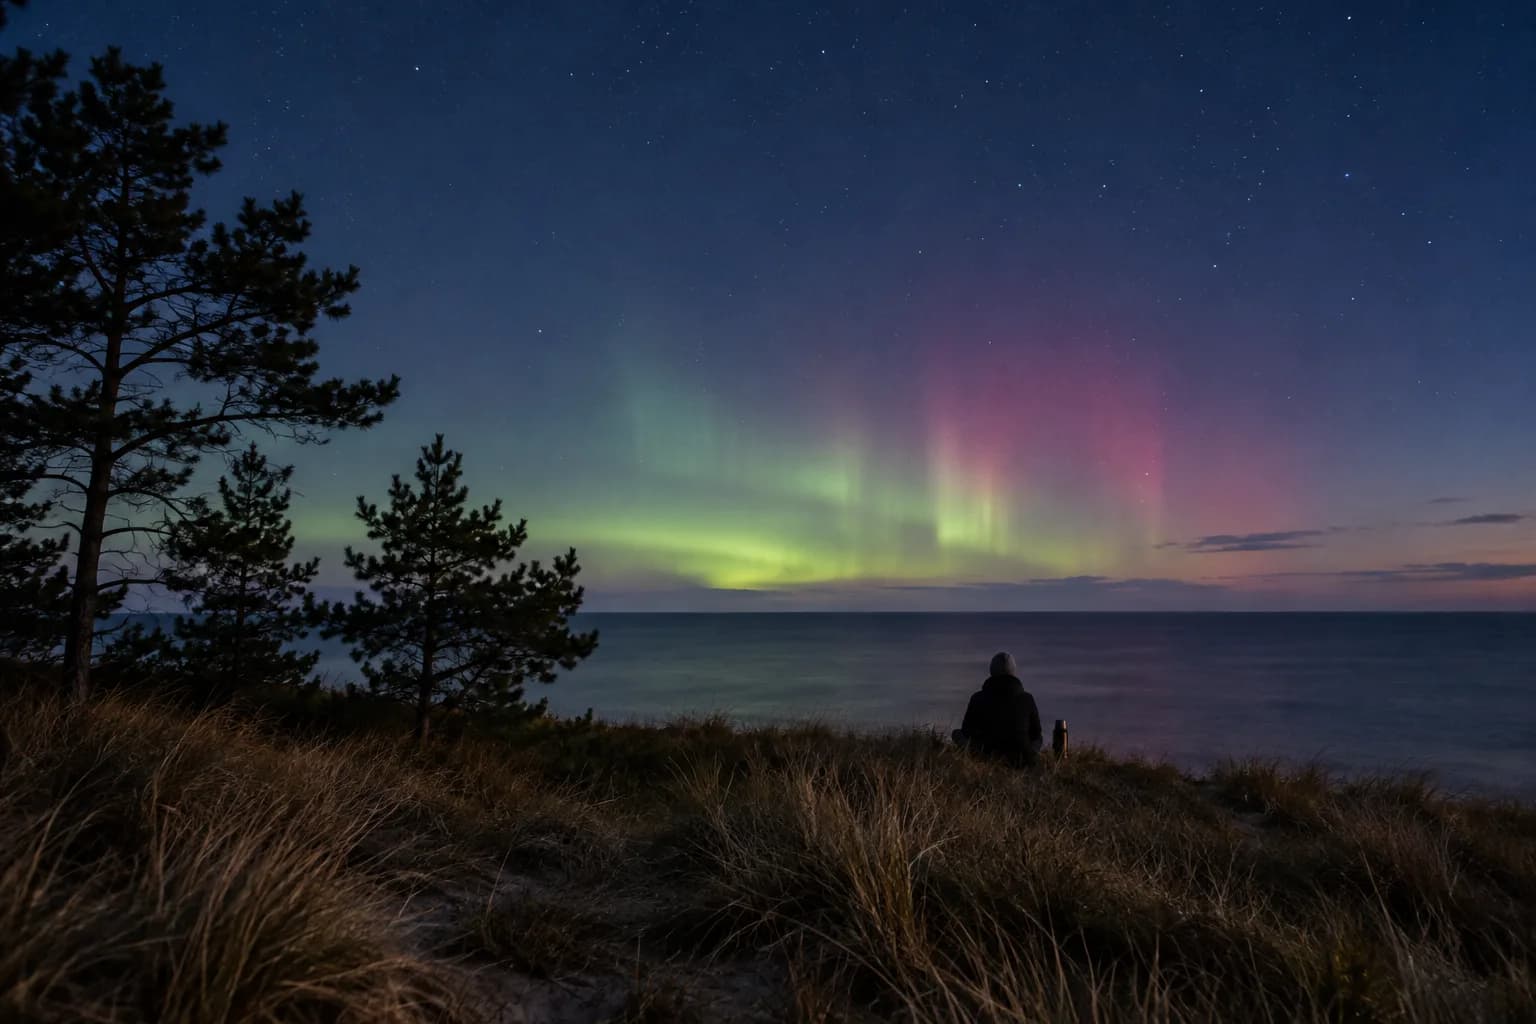

A geomagnetic storm forecast for the rest of October, straight from the source: the 27-day outlook issued by NOAA's Space Weather Prediction Center (SWPC) at 03:45 UTC on 12 October 2026 flags three days of minor G1 storming, 13 October, 31 October and 1 November. It expects an active but sub-storm field on 22–23 October (Kp 4) and quiet conditions on 16–20 and 25–30 October. Two days ago, on 10 October, the planetary Kp index hit 7, a strong G3 storm, so if you have been searching for "northern lights tonight" lately, you are not imagining the buzz.
Below you will find the actual forecast in a table and a chart, a plain guide to reading Kp and the G scale, what Kp you need to see the aurora from the northern US and the UK, and what research has really found about storms and health. A 27-day outlook is only a rough guide, so for the day-by-day picture check our geomagnetic storm forecast for today, which pulls NOAA data every day.
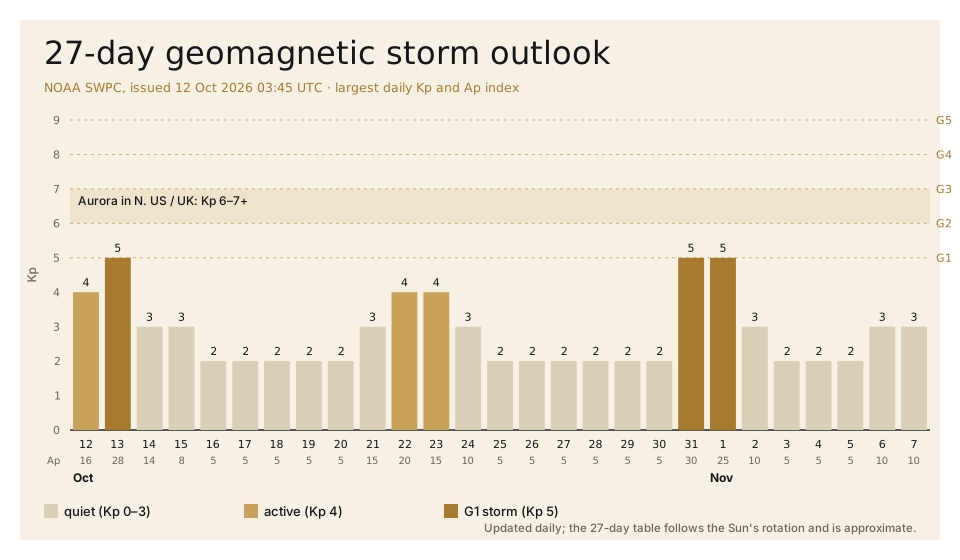
- G1 storms forecast: 13 Oct, 31 Oct and 1 Nov (Kp 5). Active on 22–23 Oct (Kp 4), quiet otherwise.
- Solar cycle: Cycle 25 peaked in October 2024 and is now declining, but NASA notes that sizeable storms often occur in the declining phase.
- Aurora: Kp 5 can bring it to the northern horizon in Scotland and the far-northern US states; most of England and the northern US tier need Kp 6–7.
- Health: observational studies have found small links with heart measures, but the evidence is mixed. Healthy people do not need to plan their lives around Kp.
Geomagnetic storm forecast: 12 October to 7 November
This table uses nothing but the NOAA SWPC 27-day outlook issued at 03:45 UTC on 12 October. For each day NOAA gives the largest expected Kp (a 0–9 scale measured in three-hour blocks) and the planetary Ap index, which summarises how disturbed the whole day is. Kp 5 means a G1 storm; Kp 4 is "active" but not a storm.
| Date | Kp | Ap | Level | What it means |
|---|---|---|---|---|
| 12 Oct (today) | 4 | 16 | active | No storm; aurora limited to high latitudes |
| 13 Oct | 5 | 28 | G1 | Minor storm; the 3-day forecast puts the peak at 06–09 UTC (07–10 BST, 2–5 a.m. EDT) |
| 14–15 Oct | 3 | 14 and 8 | unsettled | Settling down |
| 16–20 Oct | 2 | 5 | quiet | The calmest stretch |
| 21 Oct | 3 | 15 | unsettled | Activity picks up |
| 22–23 Oct | 4 | 20 and 15 | active | Not a storm, but worth checking the daily forecast |
| 24 Oct | 3 | 10 | unsettled | Settling down |
| 25–30 Oct | 2 | 5 | quiet | Quiet |
| 31 Oct | 5 | 30 | G1 | Minor storm on Halloween; timing within the day not yet known |
| 1 Nov | 5 | 25 | G1 | Minor storm; timing within the day not yet known |
| 2–7 Nov | 2–3 | 5–10 | quiet | Quiet |
The chart shows the full 27-day run. Gold bars are G1 days, lighter bars are active days, and the shaded band at Kp 6–7 marks the level at which the aurora becomes a realistic sight across the northern US states and most of the UK. Nothing in this outlook reaches that band.
Why 31 October and 1 November?
The 27-day outlook is not guesswork. The Sun turns roughly once every 27 days, so coronal holes that pour out fast solar wind tend to face Earth again a month later. NOAA's observed data show Kp reaching 5.33 (G1) on 5 October; add 27 days and you land on 1 November, exactly where the outlook now marks G1. Repeat storms of this kind are usually modest.
What the 27-day table cannot foresee are coronal mass ejections (CMEs), which cause the sudden jumps. NOAA's 3-day forecast text (issued 12:30 UTC on 12 October) mentions a negative-polarity coronal hole high-speed stream and a possible glancing blow from a CME that left the Sun on 12 October, and puts the largest expected Kp for 12–14 October at 5.00 (G1). This can change within hours, so check our daily Kp and storm page before you plan a night out.
What happened on 10 October
According to NOAA's observed values, Kp reached 7.0 between 15:00 and 18:00 UTC on 10 October, a strong G3 storm, and held at 6.67 for the following three hours. In the UK that was late afternoon into evening (16:00–22:00 BST); in the eastern US it was 11 a.m. to 5 p.m. EDT, so the peak fell in daylight there. By today Kp had dropped back to 3–4.
How to read Kp and the G scale
Kp is compiled from magnetometers around the world and describes how much Earth's magnetic field was disturbed over a three-hour window. The scale is quasi-logarithmic, so Kp 7 is not "a bit more" than Kp 5 but a much larger disturbance. NOAA ties each level to its G scale and describes what happens to technology.
| Kp | NOAA level | What happens (per NOAA) | How often in an 11-year cycle |
|---|---|---|---|
| 0–3 | quiet | No effects | most days |
| 4 | active | Aurora at high latitudes, no tech effects | often |
| 5 | G1 Minor | Weak grid fluctuations; migratory animals affected; aurora commonly visible in northern Michigan and Maine | about 1,700 times (900 days) |
| 6 | G2 Moderate | Voltage alarms in high-latitude grids; HF radio fades; aurora seen as low as New York and Idaho | about 600 times (360 days) |
| 7 | G3 Strong | Voltage corrections may be needed; intermittent satellite navigation problems; aurora seen as low as Illinois and Oregon | about 200 times (130 days) |
| 8, incl. 9− | G4 Severe | Widespread voltage problems; satellite navigation degraded for hours; aurora as low as Alabama and northern California | about 100 times (60 days) |
| 9 | G5 Extreme | Possible grid collapse in places; HF radio out for 1–2 days; aurora as low as Florida and southern Texas | about 4 times (4 days) |
One thing stands out: NOAA's geomagnetic storm scale lists effects on power grids, satellites, radio and navigation. It lists no effects on human health. Biological effects appear only on NOAA's separate solar radiation storm (S) scale, and they concern astronauts and high-flying aircrew at high latitudes, not people on the ground.
Where the solar cycle stands
On 15 October 2024, NASA, NOAA and the international Solar Cycle Prediction Panel announced that the Sun had reached the maximum period of Solar Cycle 25, and said the maximum phase would probably last another year or so before the declining phase began. NOAA's own observations bear that out: the smoothed sunspot number peaked in October 2024 at 160.9, had fallen to 94.5 by March 2026, and the September 2026 monthly mean was 60.3. We are now in the declining phase. NOAA expects Cycle 26 to begin some time between January 2029 and December 2032.
Declining does not mean quiet. In the same announcement NASA noted that scientists often see fairly significant storms during the declining phase. NOAA also points out that larger storms tend to cluster around the spring and autumn equinoxes, which is why October is a good month for both storms and aurora.
Aurora forecast: what Kp you need in the US and UK
NOAA gives a handy rule: at Kp 0 the equatorward edge of the auroral oval sits at about 66° geomagnetic latitude, and each step of Kp pushes it roughly 2° further south. From a hilltop with a clear northern view, you can see aurora up to about 1,000 km (600 miles) away. Geomagnetic latitude differs from the map: by our calculation (dipole model) London sits near 53.4°, Edinburgh near 58°, Minneapolis near 53.5°, Seattle near 53° and New York City near 50°.
| Kp | Oval edge | Realistic chance |
|---|---|---|
| 4 | ~58° | Northern Scotland on a dark night; Alaska, northern Canada |
| 5 (G1) | ~56° | Scotland and northern England low on the horizon; northern Maine, Michigan's Upper Peninsula, northern Minnesota, mostly on camera |
| 6 (G2) | ~54° | Most of the UK on the northern horizon; northern US tier from Washington to New England |
| 7 (G3) | ~52° | Southern England; down to Illinois and Oregon per NOAA |
| 8–9 (G4–G5) | ~50–48° | Bright, moving displays across much of the US and all of the UK |
NOAA stresses that these links are approximate averages. Still, they explain why the 31 October and 1 November G1 days are a "maybe" for Scotland and the northern border states and not much more for London or New York. For US readers, note that the 13 October peak (06–09 UTC) falls in the small hours across the continental US, so the northern tier has a slim window that night. For the rest of this week's sky, see our night sky guide.
How to improve your odds when Kp reaches 6–7
- Timing: NOAA says the best aurora is usually within an hour or two of local midnight, roughly 10 p.m. to 2 a.m.
- Darkness: get away from city lights. A full Moon makes the aurora look fainter.
- A northern view: a hill, a lake or the coast with nothing blocking the north.
- Your phone: night mode with a few seconds of exposure often picks up colour your eyes cannot yet see.
- Clocks: NOAA times are in UTC. The UK falls back to GMT on 25 October (BST is UTC+1 until then); the US falls back on 1 November (EDT is UTC−4, PDT UTC−7 until then).
What geomagnetic storms actually affect
Technology
On NOAA's scale the real-world effects land on systems that depend on the ionosphere or on long conductors. Satellite navigation (GPS) can become less accurate during G3 and stronger storms, which matters most to precision agriculture, surveyors and drone operators. High-frequency radio fades at high latitudes. Power grids see fluctuations that operators manage. A G1 or G2 storm does nothing to your phone, wifi or household electronics.
Health: what studies found
When it comes to people, it is important to separate observational associations from proven cause and effect. Here is what the abstracts we read actually report:
- Deaths in 263 US cities (2019). Harvard researchers found a statistical link between Kp and total, cardiovascular and heart attack deaths. The effect was small: in autumn, a one-standard-deviation rise in Kp went with a 0.31% increase in total deaths. No positive link with stroke was found.
- Heart rate variability (2022). In 809 older men (average age 74.5) from the Normative Aging Study near Boston, higher Kp in the 15 hours before an ECG went with lower heart rate variability (r-MSSD about 14.7 ms lower). The link was stronger in men with coronary heart disease.
- Cardiac arrests in Kaunas, Lithuania (2026). An analysis of 1,507 out-of-hospital cardiac arrests found that patients without a shockable heart rhythm were less likely to regain circulation from the second day of a storm to two days after it. Patients with a shockable rhythm actually did better on high-activity days.
- Acute coronary syndrome in Kaunas (2020). Data from 4,076 patients showed a handful of links in specific subgroups, for example a higher risk among obese patients in the days between storms (odds ratio 1.72).
A 2025 scoping review of 36 studies on geomagnetic activity and cardiovascular events found that 28 reported a significant link and 8 found none. The authors stress that the findings are inconsistent, that many studies use ecological designs with uncontrolled factors, and that the conclusions remain preliminary. A 2026 systematic review notes that most of the field studies the heart and circulation, while psychological states are studied far less.
What does that mean in practice? Any links are small and mainly concern people who already have heart disease. Blaming headaches, tiredness or low mood on storms rests largely on surveys and personal experience, not on controlled trials. How you feel is real, but the cause may just as well be sleep, the weather, stress, or the expectation that "today will be bad".
How to plan a storm day if you feel weather-sensitive
If you notice that you feel worse on certain days, there is no harm in planning those days more gently, the way you would plan a heatwave day. The key is to choose steps that are useful in their own right, whether or not the storm is to blame.
The evening before
- Check tomorrow's Kp forecast and the daily overview so you know whether a storm is expected and when.
- Go to bed at your usual time. A bad night affects how you feel far more than any proven storm effect.
- If sleep is your weak spot, Mind University has SleepWell, made for sleep.
On the day
- Water: drink regularly, especially if you drink coffee.
- Less caffeine after lunch: it can amplify jitteriness and disturb sleep.
- Daylight and movement: half an hour outdoors helps keep your body clock steady.
- Breathing: slow breathing with a long exhale is a quick way to take the edge off.
- Demanding tasks: if you have a choice, move them to the morning when you are fresh.
Breathing exercises have the firmest evidence here. In a 2023 Stanford randomised trial with 111 participants, five minutes a day of "cyclic sighing" (a double inhale followed by a long exhale) for a month produced the biggest improvement in mood and the largest drop in resting breathing rate, compared with other breathing exercises and mindfulness meditation. The study involved healthy adults and had nothing to do with geomagnetic storms, but the exercise suits any tense day. Try it below or set your own pace with the breathing timer.
Comments (0)
No comments yet. Be the first!
Only logged-in users can comment. Register — and you'll be able to share your thoughts on this article.
Register